| |
![]()
 Equinox Trend
The published date and time (nearest Minute) for March Equinoxes from 1990 to present time is Tabulated at a Navy site. For dates earlier than 1990 I used the data from another site. Note: If one compares the dates and times between the two sites from 1990-2001 one will find only one minute of difference for one of the reported years. Not enough to change the shape of the following curves. Because of the amount of variation in data points from year to year, a large number of points was needed to get a good average and see the current trends.
The trend for the last 52 years (1950-2001) is shown as a +1.12 sec/year slope.
The trend for the last 42 years (1960-2001) is shown as a +0.92 sec/year slope.
The trend for the last 32 years (1970-2001) is shown as a +3.43 sec/year slope.
The trend for the last 22 years (1980-2001) is shown as a +7.99 sec/year slope.
The trend for the last 12 years (1990-2001) is shown as a +31.2 sec/year slope.
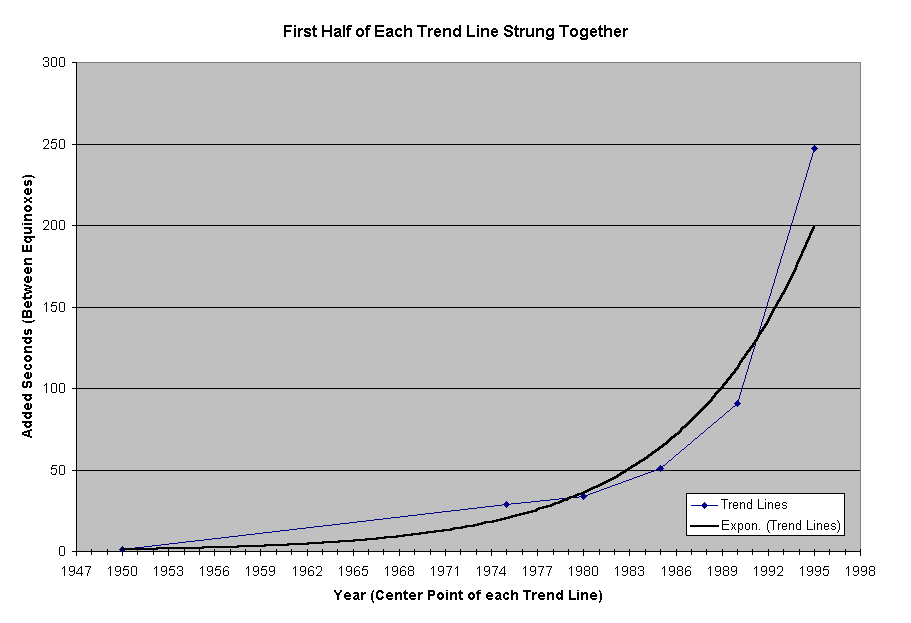
If one now takes the left half of each trend line and strings them together for the appropriate number of years that they would apply to then one gets a definite trend. This curve changed to seconds (of change) from year to year then gives the chart below. The times are trending to become longer between Equinoxes.
This could obviously mean a slowing yearly rotation of the earth around the sun. Could this in any way indicate a slowing daily rotation of earth? Not, directly. If
atomic time is not being tampered with then I think our results mean slowing of yearly rotation around the sun. If Atomic time is being adjusted slower with
undocumented added leap seconds to match a slowing daily earth's rotation, and if the earths yearly rotation around the sun were a constant, then we should see
less daily turns of the earth to get back to the same Equinox condition in the earths orbit and thus an apparent speed up of the earth's yearly rotation. We are seeing
the opposite of this. I think it is doubtful that the daily rotation is speeding up and the atomic clocks are speeding up. This would be in the wrong direction. Thus, I
think the most likely conclusion is the earth's yearly rotation around the sun is slowing down faster than the earth's daily rotation or the atomic clocks are being
adjusted to match the slow down. 31 sec/year slow down trend over the last 12 years is a significant amount. Earlier than 42 years ago it trended to only about 1
sec/year.
Assumptions for these graphs:
The best way to measure earth's slowing is by daily accurate telescope measurements of some fixed object in the sky or by long wave radio interferometer of distance radio sources and several receivers on earth that measure the changing nodes with angle. What we need is to have a way to get access the results of this kind of data. The above analysis was interesting but did not get us direct data on earth's daily rotational slowing. One could say if the yearly rotation of earth is slowing why not the daily? But, this is a stretch, without hard facts.
Offered by Mike.
